Strategy. Innovation. Brand.
Happiness, Brand, and Innovation
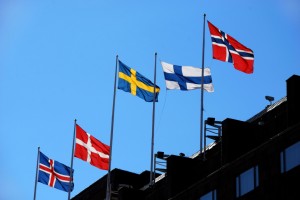
World leaders.
Are Finland, Sweden, and Switzerland the three best countries in the world? You might think so based on the latest rounds of research.
In the past, I’ve reported on the World Happiness Report (WHR) and the Global Innovation Index (GII). Both studies are produced regularly and measure a country’s ability to promote specific outcomes. The WHR measures how happy a country’s citizens are and why. The GII measures how effectively a country promotes and protects innovation, especially in regards to scientific and technical innovation.
In a previous article, I compared happiness and innovation. There seems to be a connection, though it’s difficult to say whether happiness promotes innovation or vice versa. Or perhaps some hidden, third variable promotes both. (By the way, I’ve also written about how happiness is measured).
This year, in addition to the updated versions of WHR and GII, I’ve added another — FutureBrand’s Country Brand Index (CBI) — that measures the strength of a country’s brand. Now in its eighth edition, CBI asks citizens of many countries to judge the most attractive countries to produce “future-positive predictions”. WHR and GII aim to measure the actual phenomenon — either happiness or innovation. CBI measures perceptions; how is a country perceived by citizens of other countries.
Putting together the three studies reveals a great deal of overlap. In the table below, I’ve listed the top ten countries in each report. Countries that make the top ten in all three studies are in red. Countries that reach the top ten in two studies are in blue. Countries that make the list in one study are in purple.
Switzerland is ranked number one in the CBI and GII studies and number three in the WHR study. It’s happy and innovative and has a positive reputation.
All of the Nordic countries — Denmark, Finland, Iceland, Norway, and Sweden — make at least one of the top ten lists. Sweden and Finland make all three. Denmark and Norway make two. Tiny Iceland makes one.
The USA makes the top ten in brand and innovation but ranks only 17th in happiness.
The lists are dominated by European Protestant countries or their offspring. Asia is represented by only three countries — Hong Kong, Japan, and Singapore. African and Latin American countries don’t make any of the top ten lists. The degree of overlap makes me wonder exactly what we’re measuring in these studies. It could be that happiness, innovation, and brand power are intimately related and that these studies measure the strength of the relationship. On the other hand, this could be an example of cultural bias. Or it could be a halo effect. Countries that are successful in one area may be viewed as successful in other areas as well. Of course, the reverse may also be true.
I plan to delve into each of these studies more closely in the future. In the meantime, please review the table below and help me sort out the relationship between the variables and the countries. What causes what?
| WHR 2013 | CBI 2013 | GII 2013 | ||
| 1 | Denmark | Switzerland | Switzerland | |
| 2 | Norway | Canada | Sweden | |
| 3 | Switzerland | Japan | UK | |
| 4 | Netherlands | Sweden | Netherlands | |
| 5 | Sweden | New Zealand | USA | |
| 6 | Canada | Australia | Finland | |
| 7 | Finland | Germany | Hong Kong | |
| 8 | Austria | USA | Singapore | |
| 9 | Iceland | Finland | Denmark | |
| 10 | Australia | Norway | Ireland |
Which Country Is The Most Innovative?
Earlier this year, I wrote about the Global Innovation Index for 2012 (and its relationship to happiness research). The 2013 GII report was recently published and surveys 142 different economies. Here’s how the Top 10 countries shifted from 2012 to 2013.
|
GII 2012 |
GII 2013 |
|
Switzerland |
Switzerland |
|
Sweden |
Sweden |
|
Singapore |
UK |
|
UK |
Netherlands |
|
Netherlands |
USA |
|
Denmark |
Finland |
|
Hong Kong |
Hong Kong |
|
Ireland |
Singapore |
|
USA |
Denmark |
|
Luxembourg |
Ireland |
The first thing you’ll notice is that the same countries dominate the leader board. Luxembourg has dropped out of the Top 10 and Finland has moved in but, otherwise, the countries are the same. The second major item is that the Nordic countries — Sweden, Finland, and Denmark — rate quite well. (Additionally, Iceland is 13th and Norway is 16th — all the Nordic countries are in the Top 20). These countries also dominate the leadership slots in research on national happiness. Apparently, there’s a connection between happiness and innovation.
You’ll also notice that Switzerland and Sweden take the first two positions in both years. The GII uses 84 indicators to rank countries on their ability to innovate. Switzerland and Sweden score high across the board. In terms of innovation, both countries deliver very balanced performance.
With the theme, “The Local Dynamics of Innovation” this year’s report looks not only at national level metrics but also at very specific, local phenomena. Here are some findings:
- Innovation hubs – these are physical locations such as Silicon Valley, Baden-Württemburg in Germany, or the Mumbai region in India. Typically, large enterprises serve as “hub champions” but government programs and policies can also play a major role. The hubs provide ideas, capital, and connections and create a virtuous circle — success breeds success.
- Democratization of innovation – companies and governments all over the world are investing in innovation and innovation hubs. The Internet has democratized innovation as has the rise of English as the global language of business. The report suggests that the region that has made the greatest strides in innovation is Latin America, with Costa Rica leading the way.
- Open innovation is growing – this is the opposite of the not-invented-here syndrome. Ideas are open and shared. Companies grant their ideas to third parties and use ideas from multiple sources. Sources may include companies, universities, or government research programs.
- Innovation is recovering – after a sharp drop in 2009, companies and governments have resumed investing in innovation. For instance, worldwide patent applications grew 7.5% in 2010 and 7.8% in 2011, significantly higher than before the crisis.
I’ve always thought that innovations result from collisions. As people, ideas, and cultures collide, creative combinations emerge in the form of innovations. The Global Innovation Index seems to confirm this on a global scale. Democratization, openness, and the hub concept suggest that “collisions” are happening more frequently and more pervasively. If so, we should see an acceleration of innovation over the next decade.
Culture — Would You Laugh At Your Boss?

We must be in a high PDI zone.
Would you make fun of your boss… to her face? If you’re from Denmark, you might. If you’re from Slovakia, probably not.
That’s one of the conclusions you might draw from the Power Distance Index (PDI), a measure of one of the “dimensions” of culture. Since the early 20th century, social scientists have worked to classify human cultures and measure how they differ from each other. The dimensions deal with fundamental concepts, like how we conceive of ourselves as individuals, the relationship between the individual and the group, how men and women relate to each other, and how we handle conflict. From these foundations, different observers have developed different numbers of cultural dimensions, ranging from a low of four to a high of nine.
Lately, I’ve been reading the work of Geert and Gert Jan Hofstede, a father-son team of cultural researchers from the Netherlands. In their book, Culture and Organization: Software of the Mind, they suggest that there are five cultural dimensions: 1) power distance; 2) individualism versus collectivism; 3) femininity versus masculinity; 4) uncertainty avoidance; 5) long-term versus short-term orientation. I’d like to look at all five of these — and their inter-relationship — over the coming weeks. Today, let’s look at power distance. (By the way, one of the reasons I like the Hofstedes is that they relate their findings to the workplace. The last several chapters of their book offer practical advice on managing in a multicultural world).
The Hofstedes define power distance as “the extent to which the less powerful … [citizens] … of a country expect and accept that power is distributed unequally.” The Hofstedes developed an index to measure power distance within a country and applied it to 74 different countries. The five countries with the highest PDI scores are Malaysia (PDI = 104), Slovakia (104), Guatemala (95), Panama (95), and Philippines (94). The five with lowest scores are German-speaking Switzerland (26), New Zealand (22), Denmark (18), Israel (13), and Austria (11). (The United States has a PDI of 40)
Power distance affects cultures in myriad ways. Countries with low PDIs generally believe that “inequalities among people should be minimized.” On the other hand, those with high PDIs generally believe that “Inequalities among people are expected and desired”. In low PDI countries, “parents treat children as equals”; in high PDI countries, “parents teach children obedience”.
In the workplace, differences between low- and high-PDI countries can be pronounced. In low-PDI countries, the workplace is generally decentralized with few supervisors. The ideal boss is a resourceful democrat and status symbols are generally frowned upon. In high-PDI countries, the situation is essentially reversed: the workplace is centralized with a large number of supervisors. The ideal boss is a benevolent autocrat and status symbols are normal and popular.
Here are two findings that struck me as very odd. In Europe and the Americas, countries with Romance languages had — on average — higher PDI scores than those with Germanic languages. In the popular imagination, Germanic countries are often perceived to be very hierarchical. The Hofstedes’ research suggests that the opposite is true. Austria (PDI= 11) has the lowest PDI of any of the 74 countries. German-speaking Switzerland has a PDI of 26 which compares to 70 for French-speaking Switzerland. Germany itself has a score of 35.
The other oddity is that PDI scores tend to drop the farther north (or the farther south) you move from the equator. Tropical lands tend to have higher power distances than temperate lands. Here are scores for some of the more northern (and southern) countries: Denmark (18), New Zealand (22), Ireland (28), Sweden (31), Norway (31), Finland (33), Australia (36), Canada (39). The Hofstedes suggest some possible reasons for this distribution but their ideas seem a bit too pat to me. While I’m scartching my head as to the cause, it may be that we’re simply measuring language differences again. None of the northern countries I’ve just listed speaks a Romance language.
So, what does it all mean? I’m still working on that. I do find it very interesting that the Nordic countries are clustered at the very low end of the PDI table while they’re at the very high end of the World Happiness Report and the Global Innovation Index. There’s something interesting in the state of Denmark. Think about that for a while. In the meantime, don’t laugh at your boss.
The Big Sort and The Big Short

Put two books in the blender. Then press “mash”.
I used to be a book monogamist. I would start a book and read it — forsaking all others — until completion did us part. Then I would find another book and start the process over again. You could say that I was a serial monogamist.
Now I’m a book polygamist. Rather then reading an entire book from start to finish, I read randomly selected chapters in more-or-less randomly selected titles. I’ll read a chapter in Book A, followed by a chapter in Book B, followed by a chapter in Book X (ooh!), followed by Book D, and then back to Book A. I started doing this because I’ve read about the mashup theory of innovation, which suggests that innovations are frequently a mashup of two (or more) existing ideas. You mash up a Broadway play with a circus and get — voilá — Cirque de Soleil. Mash up a sports car and a sedan and you get – hier ist — a BMW.
Since most books really only have one idea (if that), I thought it would be useful to mash up ideas from multiple books at the same time. What do I have to show for my efforts? Well, I’m probably one of the few writers to mash up the Global Innovation Index with the World Happiness Report (click here). I’m about to mash up those two with measures of national cultural dimensions. I’ve also discovered that countries become more egalitarian (as measured by the power distance index) the farther north you go. I’d like to mash that up with another little-known fact — the incidence of multiple sclerosis increases the farther north you go. I’m not sure what egalitarianism has to do with MS but, at the very least, it’s an interesting question to ask.
At the moment, I’m reading The Big Sort and The Big Short more or less simultaneously. Given their titles, the two books seemed just perfect for mashing up. The Big Sort is subtitled, Why The Clustering of Like-Minded America is Tearing Us Apart. The basic idea is that we have sorted ourselves into homogeneous thought clusters. As the author points out, “The result is a country that has become so polarized, so ideologically inbred that people don’t know and can’t understand those who live a few miles away.” (For my previous article on The Big Sort, click here).
The Big Short, subtitled Inside The Doomsday Machine, tells the story of how a few people made bazillions of dollars by recognizing the mortgage bubble and betting against it. Of course, the mortgage bubble also triggered the biggest financial crisis since the Depression. Both books tell fascinating stories about modern America. By reading them together, I’m trying to mash them up. Could it be that thought clusters led to the doomsday machine? By separating ourselves into “ideologically inbred” clusters, did we help establish the conditions that produced a massive bubble? I’m still trying to tease the two together but, if nothing else, it’s another interesting question to ask.
I once took a course called Comparative Literature. Among other things, we compared the epic Spanish poem The Cid with Albert Camus’ The Stranger. We found surprising parallels in plot, structure, and description. What I’m doing now is really not that different. It’s a surprisingly good (and easy) way to come up with interesting insights. So, what do you think? What books would you like to see mashed up?
My Social Media
![]()
![]()
![]()
![]()
